Flows Orientation
The main elements of Flows are:
Workspace
The Workspace is where you access and manipulate nodes, make connections among nodes, and make node configuration settings using the Inspector.
The Workspace is optimized for manipulation of visual elements, and there’s a subset of configuration changes that can be made via the Inspector.
Whenever you change elements on the workspace, save your changes so it’s the same when you come back to it after navigating to other parts of Console.
Nodes and Edges
Nodes
Nodes are graphical representations of Console elements and for quick identification are color coded. Connection points are used to create relationships among nodes.

Devices: device nodes represent the hardware that is sending the packets. Since devices are the source of data and integrations can only receive data there’s only one connection point for edges.

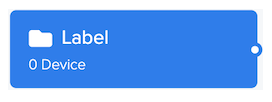
Labels: label nodes represent a group of devices with a common

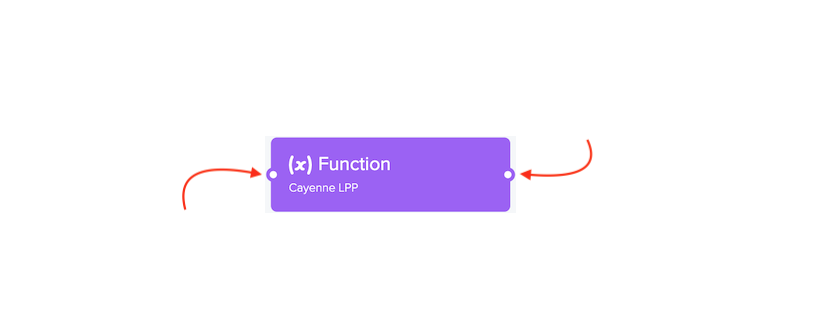
Functions: users can transform and/or parse payloads before sending to an endpoint. Functions can both receive data from devices and continue sending data after taking action to integrations.

Integrations: enable devices to customer endpoints over HTTP or MQTT.

Edges
Edges represent the flow of data from device or label nodes moving from left to right. Edges use connection points create relationships among nodes.
Users can control the flow of device data using edges to provide the following connections from devices/groups of devices (via labels):
- to integrations
- to functions
- to function and on to integrations

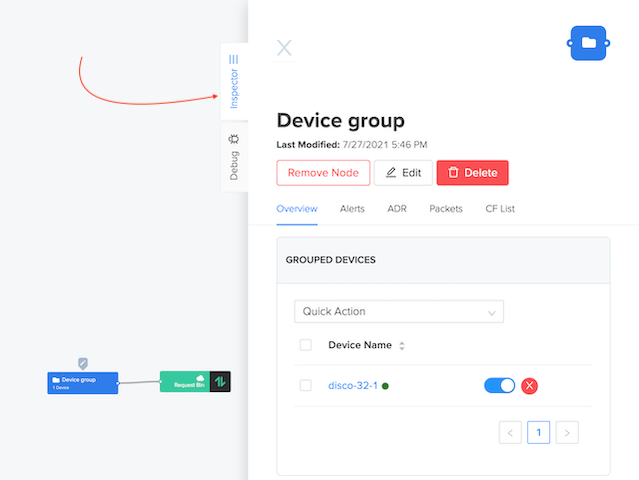
Inspector
The Inspector provides the ability to:
- Visually inspect node details
- Make common node configuration changes
- Access node in other areas of Console for more complete edits

To access the Inspector simply click a node and different options appear for the following:
- Devices or Labels
- Functions
- Integrations
Debug Mode
The Console Debug tool allows you to quickly and easily examine device messages. This enables you to verify and debug issues much more easily without requiring the data to be sent to an application endpoint first. For security and privacy reasons the Debug tool does not persist data. Instead, the 40 most recent events are accumulated from the time the Debug window is opened.

For more information about Debug Mode go here.